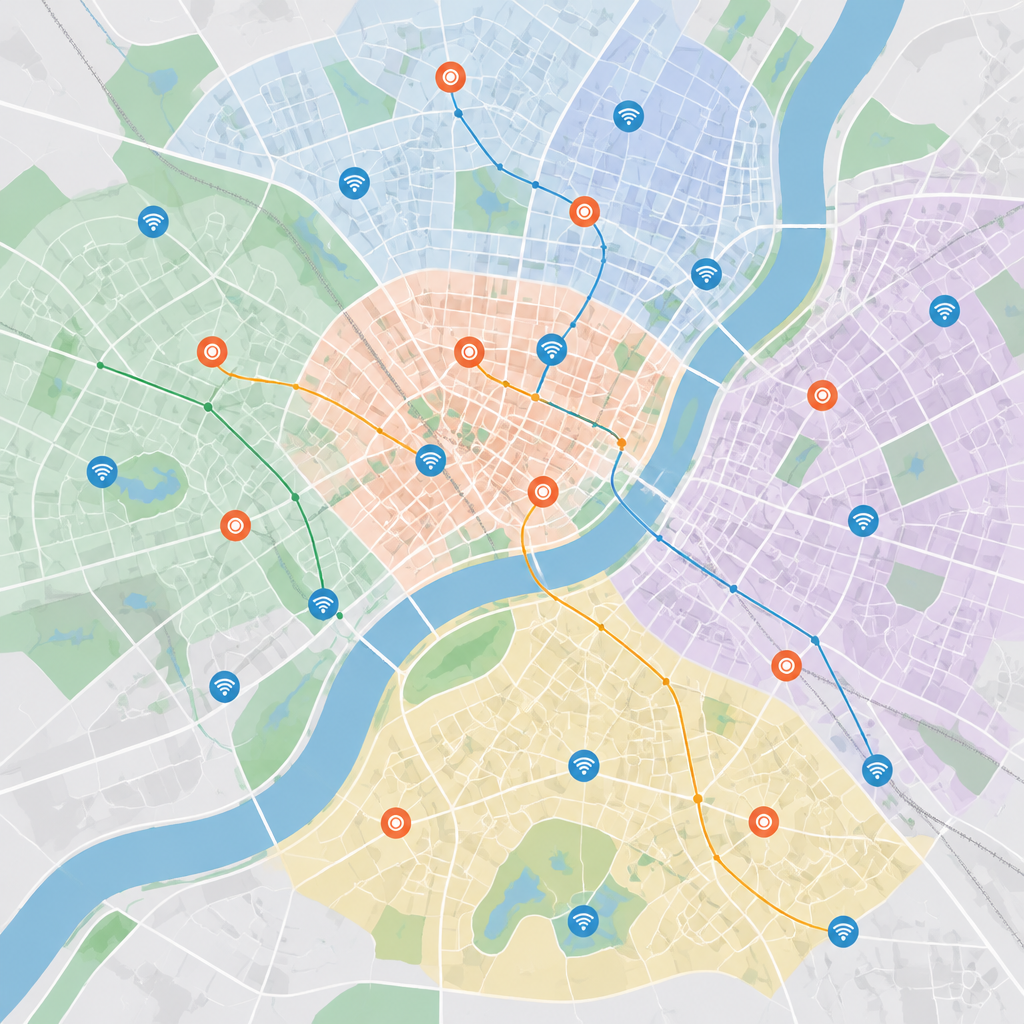
India’s Telecom Regulatory Authority launched Network Anubhav on November 4, 2026. TRAI says the dashboard brings together observations from its MySpeed and MyCall apps and independent drive tests. Its maps let readers distinguish cellular from fixed broadband and filter results by provider and technology.
Start with a comparison that matches your connection
If you want to compare mobile service, select cellular tests and compare the same technology in the area you care about. Fixed broadband measurements answer a different question. Check how many observations are visible and where they were taken before drawing a conclusion from a single figure.
A median describes the tests, not your next connection
TRAI describes P50 as the median speed. In a fictional example, five tests record 5, 10, 20, 35 and 60 Mbps. The median is 20 Mbps. That middle value does not tell you what speed you would get at a specific building or time. It also leaves out the spread between the lowest and highest observations.
Treat user tests as observations rather than a representative survey. TRAI itself says those results do not provide a comprehensive assessment of network quality. Keep independent drive-test results separate when reading the map; note the source of the figures before comparing them.