Renault Duster Hybrid vs Petrol: When Do Fuel Savings Pay Back?
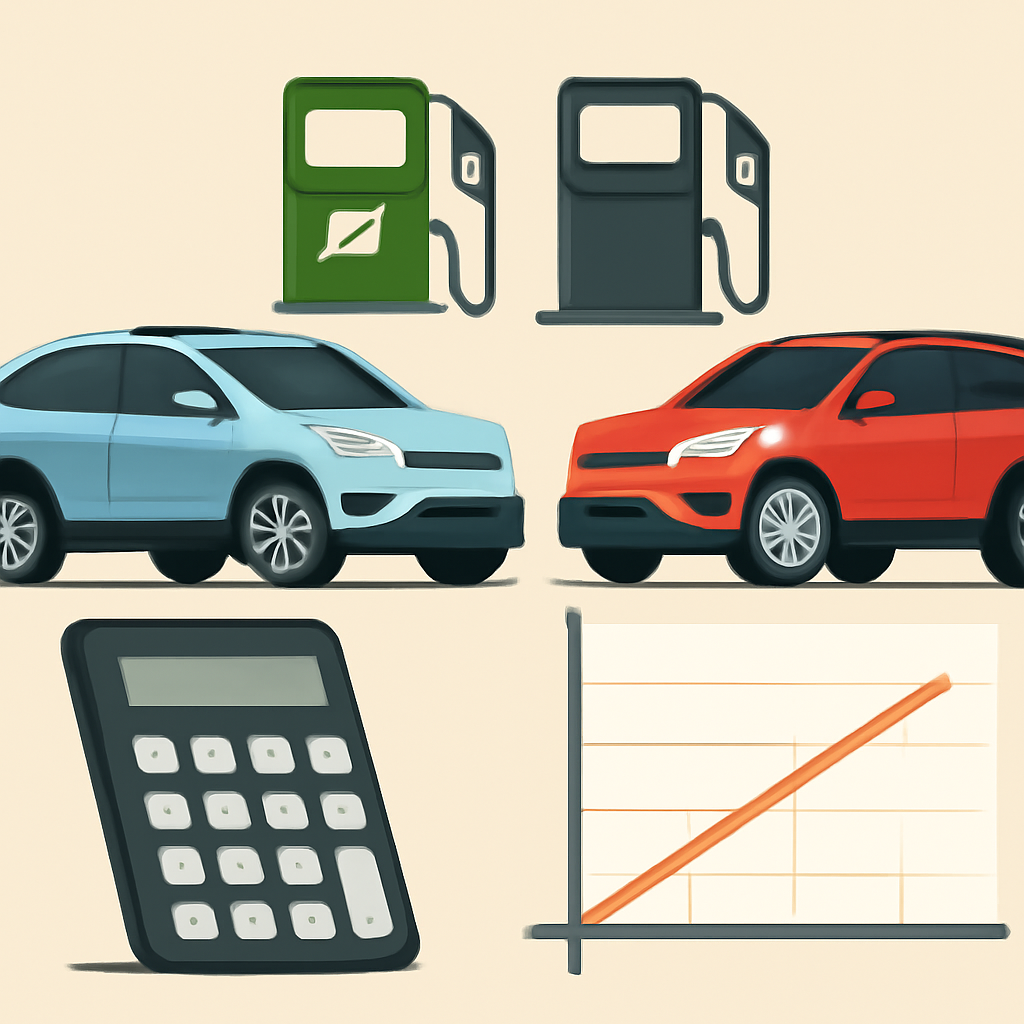
This fuel-payback worksheet helps compare a hybrid with a petrol car. It helps estimate how long fuel savings might take to offset an assumed extra upfront cost for a hybrid versus a petrol comparator. The key idea is straightforward: if the hybrid uses less fuel per kilometre, the monthly savings can be converted into a break-even period. But the result depends heavily on your own mileage, fuel price, and the real-world efficiency you actually achieve. Official claims are useful as a starting point, but they are not a guarantee of everyday results.
What Renault officially says
Renault’s India pages describe the Duster Hybrid as starting at ₹16,99,000, with a 1.8L engine, a 1.4kWh self-charging hybrid system, and a certified fuel-efficiency figure of 29 kmpl. These are official product claims, but certified figures do not automatically match real-world driving, traffic, terrain, AC use, load, or driving style. For detailed product information, see the official Duster page and Renault’s E-Tech Full Hybrid explainer.
Official Renault Duster Hybrid page
Renault’s E-Tech Full Hybrid page explains the hybrid concept in broader terms: the system is self-charging, designed to recover and reuse energy, and meant to reduce fuel use in everyday driving. That matters because the payback calculation depends less on the badge and more on the gap between your petrol running cost and the hybrid’s running cost. If your real-world use is mostly highway cruising, mostly city stop-go traffic, or a mixed pattern, the answer can change materially.
Official Renault E-Tech Full Hybrid page
Editable worksheet assumptions
- Petrol price: ₹100 per litre
- Petrol efficiency: 15 kmpl
- Hybrid efficiency: 22 kmpl
- Monthly driving: 1,000 km
- Extra upfront price for the hybrid versus a comparable petrol quote: ₹2,00,000
These are illustrative assumptions only, not verified current prices, not official road-test results, and not actual model measurements. They are included only to show how the math works. If your fuel price, mileage, or price gap differs, your break-even timeline will also differ.
How the math works
Fuel cost per kilometre is calculated by dividing fuel price by efficiency. Under the assumptions above, petrol costs ₹100 ÷ 15 = ₹6.67 per km, while the hybrid costs ₹100 ÷ 22 = ₹4.55 per km. The difference is about ₹2.12 saved per kilometre. At 1,000 km a month, that becomes about ₹2,121 in monthly fuel savings. If the extra upfront price is ₹2,00,000, the simple fuel-only payback period is about 94.3 months, or 7.86 years.
That is a long time, and it is the main takeaway from any fuel-payback exercise: savings can be real, but they are not instant. If you drive more, pay more for fuel, or see a bigger real-world efficiency gap in favour of the hybrid, the payback improves. If you drive less, get better-than-assumed petrol mileage, or the hybrid’s real-world gap narrows, payback worsens.
Mileage sensitivity table
- 500 km/month: about ₹1,061 saved per month; payback about 15.7 years
- 1,000 km/month: about ₹2,121 saved per month; payback about 7.9 years
- 1,500 km/month: about ₹3,182 saved per month; payback about 5.2 years
- 2,000 km/month: about ₹4,242 saved per month; payback about 3.9 years
This table shows why the same car can look sensible for one buyer and expensive for another. A high-mileage commuter will recover fuel savings far faster than a low-mileage owner. In other words, the hybrid case strengthens as annual usage rises.
Why certified efficiency is not the full story
Certified figures are useful for comparison, but they are not a promise of identical real-world consumption. Urban traffic, frequent braking, cold starts, mountain roads, heavy cargo, tyre condition, weather, and AC use can all change outcomes. That is especially important for hybrid vehicles, because the actual savings depend on how often the system can recover energy and how the car is driven. A real buyer should therefore treat 29 kmpl as a certified reference point, not a guaranteed daily average.
The same caution applies to the petrol comparator. If the petrol car returns better-than-assumed mileage, the hybrid’s fuel advantage shrinks. If the petrol car is thirstier than assumed, the hybrid looks better. The worksheet is meant to be adjusted, not memorised.
What this worksheet does not include
- Finance costs and loan interest
- Insurance differences
- Servicing and maintenance differences
- Tyres, wear items, and repair costs
- Depreciation and resale value
- Taxes, registration, and on-road pricing differences
Those omitted items can materially change ownership economics. A buyer who wants a fuller decision should combine fuel payback with total-cost-of-ownership factors. This worksheet intentionally keeps the scope narrow so the fuel math stays transparent.
Simple decision rule
If you drive far enough each month, and if the hybrid really delivers a meaningful fuel-efficiency gain in your use case, fuel savings can eventually offset a higher purchase price. If you drive relatively little, the payback can stretch beyond the time you plan to keep the car. That is why the answer is not “hybrid always wins” or “petrol always wins.” The right choice depends on your mileage, your local fuel price, and the real-world gap you actually experience.
Practical takeaway: the hybrid’s value is strongest for higher-mileage buyers who can convert fuel savings into a shorter payback period. For lower-mileage owners, the break-even horizon can be too long to matter.
Use comparable quotes and handle the edge cases
Use the difference between actual dealer quotes for comparably equipped variants. Subtracting the cheapest petrol entry price from a higher-equipped hybrid price does not isolate the cost of the hybrid system. Divide the extra upfront price by monthly fuel savings to calculate payback. If monthly driving is zero, there is no fuel-saving payback. If savings per kilometre are zero or negative, a positive price premium cannot be recovered through fuel savings. A zero premium needs no recovery. Use positive, finite fuel prices and efficiency values.
Editorial research note — review before publication
Research: 18 October 2026, started 12:15 IST. Ten web search queries; eight finalist angles assessed. Google Trends USA and India: 25 displayed rows each inspected; third-party Trends24 USA snapshot dated 18 October 05:52 UTC inspected, not authenticated X analytics. Official Renault sources checked. India parent cluster 'renault duster hybrid': 20K+ searches, +1000%, active, started 22 hours before snapshot in the past-24-hours view. This is parent-topic demand, not measured demand for this worksheet or remaining-day demand. https://trends.google.com/trending?geo=IN
Selection: vehicle technology/ownership economics, after screening USA opportunities. Exact queries for Duster hybrid break-even calculator and fuel-savings calculator returned general comparisons and forum discussion rather than a verified dedicated current India tool in the inspected results. Lower competition is a provisional inference; not exhaustive proof or a measured keyword-difficulty score. Parent momentum confidence medium; worksheet-query traffic and ranking confidence low. Opportunity horizon 18–48 hours.
Seven rejected angles: China solar export proposal — existing Reuters/AP/trade coverage, no verified quantified demand; AI infrastructure financing — overlap with existing IDs 5/6; industrial AI acquisitions — no verified demand or underserved angle; SoftBank/Allied — tentative deal and unverified demand; Attie builder — several existing explainers, unverified demand; generic Duster launch — crowded established automotive coverage; fall-back/calendar timing — overlap ID 16. Eight finalists including the selected worksheet. Fourteen existing article bodies checked; lists rechecked before and after generation; no Duster fuel-payback duplicate found. Other task hidden run history and pending selections inaccessible; no shared atomic lock verified.
Forecast: insufficient evidence to quantify same-day visits in either a specified first-page position scenario or a realistic site-specific scenario. Remaining-day query demand, position-specific CTR and indexing/ranking probability are not established; zero same-day visits remains possible. Ten thousand visits is not substantiated. Future scenario formula: relevant remaining-day demand multiplied by explicitly assumed position-specific CTR. No calibrated predictive model claimed. A static worksheet is included; no functioning calculator is claimed. Generation attempt 1 returned HTTP 429 (reference ed3766825ce9); retry with the same topic key queued job 61 and completed article 18 as draft. One inside image and existing-file thumbnail verified. No publication performed.